Sharing your map
In this exercise, we will be learning how to share a map on the web with GitHub Pages. GitHub Pages allows you to host your website at no cost for anyone to view. We'll be using the GeoJSON data from the QGIS basics desktop exercise. You can follow the instruction from the linked exercise to download the necessary data.
GitHub account
Note: If you have a GitHub account, you can skip this section.
First, you will need to make a GitHub account. Go to: GitHub.com and create an account. After you create an account, the next step is to create a repository, or a repo for short. To learn more about GitHub and repositories, click here.
GitHub repository
What is a GitHub repository?
A repository is like the central hub for a project. The repository will contain all of your files for the project. By making a repository, you can: track changes to your project, allow for multiple people to collaborate on your project, allow you to show different versions of your project, and you can even make it public or private.
Create your repository
Let's start by creating a GitHub repository. Now that your account has been created, click on the green "New" button. At the top it should say "Create a new repository." You will see your GitHub name with an empty repository name. Create an appropriate name for your project here. Next, create a small description of your project in the "description" text box. Make sure that we are on "Public" under "Choose visibility." After, click the button to turn on "Add README." Finally, click the green "Create repository" button towards the bottom.
Uploading files to our repository
Now that we have an empty project repository, we want to upload our files into it. Click the "Add file" or "+" button next to the green "<> Code" button. Next, click "upload files" and go to your files on your computer.
If you have followed the previous exercises:
Find the folder containing all of your project files. This file should contain your QGIS save file (ending with the .qgz extension), .geojson, along with other saved layers. We don't need all of these files, We will only need the .geojson file that we downloaded from the City of San Diego Open Data Portal.
Add only this file by dragging it to where it says, "Drag files here to add them to your repository." Next, click on the green "Commit changes" button after the file has loaded.
If you have NOT followed the previous exercises:
Find the .geojson file that you downloaded at the beginning of this exercise. It should be under downloads if it has recently been downloaded. Drag this file in, then commit the changes.
Note: Make sure that this .geojson file is not inside a folder on GitHub, otherwise the map will not show up when we make our page. This is because GitHub pages will only check under root and not inside of a folder. If for some reason this .geojson file is inside of a folder, you will need to move it from outside of the folder it's in.
Adding Leaflet files
Note: You will need Visual Studio Code or some type of text editor.
We will use Leaflet, a JavaScript library to display our map. Refer back to the web mapping libraries lesson for more information and more open-source libraries.
We will need to create 3 files:
- index.html - contains the structure of our map and text or headings
- script.js - JavaScript code that uses Leaflet to upload our map layers
- style.css - stylesheet that determines the appearance of the map and page
Create these 3 files somewhere on your computer so you can drag them into GitHub after. Use a text editor to add the following code below:
<html>
  <head>
    <title>QGIS Drinking Water Map</title>
    <meta charset="utf-8" />
    <meta name="viewport" content="width=device-width, initial-scale=1.0" />

    <!-- Leaflet CSS -->
    <link
      rel="stylesheet"
      href="https://unpkg.com/leaflet/dist/leaflet.css"
    />

    <!-- Custom stylesheet -->
    <link rel="stylesheet" href="./style.css" />
  </head>
  <body>
    <div id="map"></div>

    <!-- Leaflet JS -->
    <script src="https://unpkg.com/leaflet/dist/leaflet.js"></script>

    <!-- Custom JS -->
    <script src="./script.js"></script>
  </body>
</html>// Create the map centered roughly on San Diego
const map = L.map('map').setView([32.7157, -117.1611], 10);
// Add the base map tiles
L.tileLayer('https://{s}.tile.openstreetmap.org/%7Bz%7D/%7Bx%7D/%7By%7D.png', {
attribution: '© OpenStreetMap contributors',
}).addTo(map);
// Load your local GeoJSON file (it must be in the same folder)
fetch('SDG_Indicator_6.3.2_Clean_Water_andSanitation-_Tract_20251021.geojson')
.then((response) => response.json())
.then((data) => {
L.geoJSON(data, {
style: {
color: 'blue',
weight: 1,
fillColor: 'skyblue',
fillOpacity: 0.5,
},
onEachFeature: (feature, layer) => {
const name = feature.properties.NAME || 'No name';
layer.bindPopup(name);
},
}).addTo(map);
})
.catch((error) => console.error('Error loading GeoJSON:', error));#map {
height: 100vh;
width: 100%;
}Recall to the section above when we added the .geojson file to GitHub. Repeat similar steps to add these 3 files to your GitHub.
Note: Again, make sure that these 3 files are not inside of a folder.
Setting up GitHub pages
Now that you have a repository, lets set up GitHub pages. GitHub pages allows you to have one "main" site per account and many "project" sites per account.
Main site example: github-username.github.io
Project site example: github-username.github.io/project-name
Towards the top of the screen, you should see a "Settings" tab. Click on it. On the left side, click on "Pages." Under "Build and deployment" and Source," it should say "Deploy from a branch." Under "Branch" select "main" and then "root" for the folder. Click save. Towards the top of the screen, click on the "Actions" tab. Here we should see something like: "Pages build and deployment." If there is a yellow loading circle, wait for a moment. If it takes a while, refresh the page and it should turn into a green check. This will show that the build is successful.
Note: If nothing pops up, go back to Pages and click "none" for the branch, then switch back to "main" to reset it.
After the build is successful, go back to "Settings" and "Pages." Towards the top, we should now see that your site is live. Click on "Visit site." Your map should now pop up!
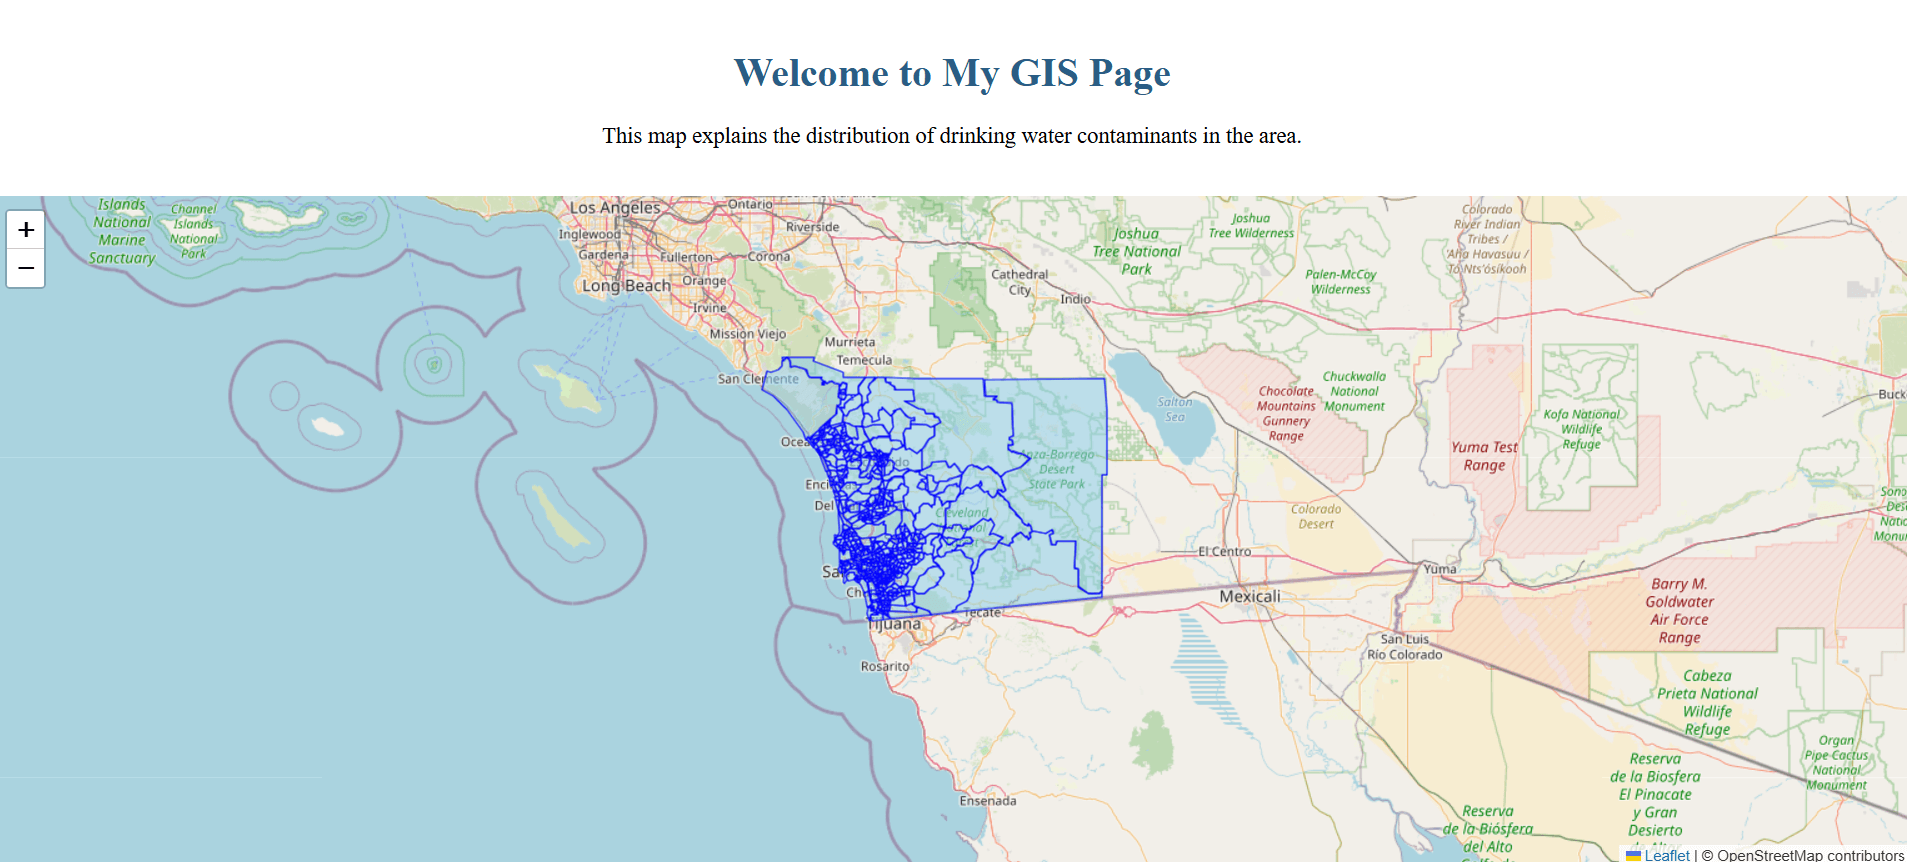
Adding text to our page
Right now, we only see the map on our github page. We can add text by editing our .html file, and fix the format by editing our .css file. Update the 3 files by using the code below:
<!DOCTYPE html>
<html>
  <head>
    <title>QGIS Drinking Water Map</title>
    <meta charset="utf-8" />
    <meta name="viewport" content="width=device-width, initial-scale=1.0" />

    <!-- Leaflet CSS -->
    <link
      rel="stylesheet"
      href="https://unpkg.com/leaflet/dist/leaflet.css"
    />

    <!-- Custom stylesheet -->
    <link rel="stylesheet" href="./style.css" />
  </head>
  <body>

    <!-- INTRO TEXT -->
    <div class="intro-text">
      <h1>Welcome to My GIS Page</h1>
      <p>This map explains the distribution of drinking water contaminants in the area.</p>
    </div>

    <!-- MAP -->
    <div id="map"></div>

    <!-- Leaflet JS -->
    <script src="https://unpkg.com/leaflet/dist/leaflet.js"></script>

    <!-- Custom JS -->
    <script src="./script.js"></script>
  </body>
</html>// Create the map centered roughly on San Diego
const map = L.map('map').setView([32.7157, -117.1611], 10);
// Add the base map tiles
L.tileLayer('https://{s}.tile.openstreetmap.org/{z}/{x}/{y}.png', {
attribution: '© OpenStreetMap contributors',
}).addTo(map);
// Load your local GeoJSON file (it must be in the same folder)
fetch('SDG_Indicator_6.3.2_Clean_Water_and_Sanitation_-_Tract_20251021.geojson')
.then((response) => response.json())
.then((data) => {
L.geoJSON(data, {
style: {
color: 'blue',
weight: 1,
fillColor: 'skyblue',
fillOpacity: 0.5,
},
onEachFeature: (feature, layer) => {
const name = feature.properties.NAME || 'No name';
layer.bindPopup(name);
},
}).addTo(map);
})
.catch((error) => console.error('Error loading GeoJSON:', error));/* Fill full viewport and remove default margin */
html, body {
height: 100%;
margin: 0;
}
/* Make body a vertical flex container */
body {
display: flex;
flex-direction: column;
}
/* Style for the intro text */
.intro-text {
text-align: center;
padding: 20px;
}
.intro-text h1 {
color: #2a5d84;
font-size: 2em;
}
.intro-text p {
font-size: 18px;
}
/* Map fills remaining space */
#map {
flex: 1;
width: 100%;
}
Have you noticed that the map is only one shade of blue? Lastly, we want to shade the areas to show the distribution of drinking water contaminants. We can do this by editing our script.js file with the code below:
// Create the map centered roughly on San Diego
const map = L.map('map').setView([32.7157, -117.1611], 10);

// Add the base map tiles
L.tileLayer('https://{s}.tile.openstreetmap.org/{z}/{x}/{y}.png', {
  attribution: '© OpenStreetMap contributors',
}).addTo(map);
function getFeatureStyle(feature) {
    const value = feature.properties["drinking_water_percentile"];

  // normalize value to a number
  const v = (value === null || value === undefined) ? NaN : Number(value);

  function getColor(n) {
    if (isNaN(n)) return '#cccccc'; // gray for unknown / missing
    // Classes: 9-20, 20-36, 36-49, 49-61, 61-95
    // Sequential blue palette (light -> dark)
    if (n <= 20) return '#deebf7';
    if (n <= 36) return '#9ecae1';
    if (n <= 49) return '#6baed6';
    if (n <= 61) return '#3182bd';
    return '#08519c';
  }

  return {
    fillColor: getColor(v),
    weight: 1,
    opacity: 1,
    color: "#666",
    fillOpacity: 0.7,
  };
}

// Load your local GeoJSON file (it must be in the same folder)
fetch('SDG_Indicator_6.3.2_Clean_Water_and_Sanitation_-_Tract_20251021.geojson')
  .then((response) => response.json())
  .then((data) => {
    L.geoJSON(data, {
      style: getFeatureStyle,

      onEachFeature: (feature, layer) => {
        const name = feature.properties.NAME || 'No name';
        layer.bindPopup(name);
      },
    }).addTo(map);
  })
.catch((error) => console.error('Error loading GeoJSON:', error));After the changes, your page should look like this:
Congratulations! You've learned how to host your map with GitHub Pages.